HDFC AMC to Declare Rs 70 Interim Dividend per Share
HDFC AMC announced an interim dividend of Rs 70 per share for FY 2024 with a payout ratio of 76.80%. The previously proposed final dividend on April 19, 2024 was replaced by the board.
by Damodharan N
Updated Jul 08, 2024
Article continues below advertisement

Table of Content
HDFC Asset Management Company (AMC) has announced an interim dividend of Rs 70 per equity share of Rs 5 each for the financial year ending March 31, 2024. This interim dividend replaces the final dividend that was previously proposed at the Board meeting held on April 19, 2024.
The record date to determine shareholders eligible for the interim dividend was June 18, 2024. This dividend results in a payout ratio of 76.80%.
HDFC AMC will hold its Twenty-Fifth Annual General Meeting on Thursday, July 25, 2024, at 3:00 p.m. (IST). The meeting will be conducted through Video Conferencing (VC) and Other Audio Visual Means (OAVM) to discuss and transact various business matters with key points are given below
Ordinary Business:
- Adoption of financial statements for FY 2024.
- Confirmation of interim dividend of Rs 70 per share.
- Re-appointment of Ms. Renu Sud Karnad as director.
Special Business:
- Approval of commission for Non-Executive Directors.
- Re-appointment of Mr. Navneet Munot as Managing Director & CEO.
- Amendment of Articles of Association.
- Extension of ESOP Scheme to employees of HDFC AMC International (IFSC) Limited.
- Approval of special rights for HDFC Bank Limited.
HDFC Asset Management Annual Report
HDFC Asset Management Company Limited (HDFC AMC) is a leading mutual fund house in India, offering a wide range of savings and investment products across asset classes.
The company provides investment management services through mutual funds and portfolio management services (PMS), along with advisory services to various clients. The company operates in a highly competitive environment and aims to provide superior risk-adjusted returns to its investors.
Key Highlights
The financial review highlights robust revenue growth driven by strong sales in both domestic and international markets. Despite economic challenges, strategic cost management initiatives have bolstered profitability, positioning the company for continued growth in the upcoming fiscal year.
- Financial Metrics:
- Total Income for FY 2023-24 increased by 27.38% to ₹3,162.43 crore.
- Profit After Tax (PAT) stood at ₹1,945.88 crore, a growth of 36.66% over FY 2022-23.
- Operating Profit (Profit Before Tax less Other income) increased by 22.21% to ₹1,900.13 crore.
- Average Networth increased by 13.31% to ₹6,593.74 crore.
- Standalone Financial Statement:
- Revenue from operations increased by 19.27% to ₹2,584.37 crore.
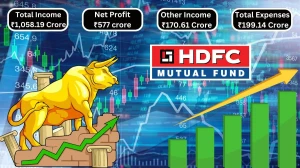
- Other income rose by 83.05% to ₹578.06 crore.
- Total income grew by 27.38% to ₹3,162.43 crore.
- Total expenses increased by 11.80% to ₹684.24 crore.
- Profit before tax increased by 32.48% to ₹2,478.19 crore.
- Year-over-Year Analysis:
- Significant growth in PAT and revenue from operations due to higher investment management fees and other income.
- Total comprehensive income increased from ₹1,424.34 crore to ₹1,944.29 crore.
|
Particulars |
For the year ended March 31, 2024 |
For the year ended March 31, 2023 |
Change (%) |
|
Annual Average AUM (₨ in Crore) |
543,710.44 |
436,126.02 |
24.67 |
|
Profit After Tax as a % of Annual Average AUM |
0.36 |
0.33 |
9.62 |
|
Debtors Turnover (times) |
18.66 |
16.78 |
11.20 |
|
Current Ratio (times) |
6.78 |
6.15 |
10.24 |
|
Operating Profit Margin (%) |
73.52 |
71.76 |
2.45 |
|
Net Profit Margin (%) |
61.53 |
57.36 |
7.27 |
Standalone statement
|
Particulars |
For the year ended March 31, 2024 |
For the year ended March 31, 2023 |
% Change |
|
Revenue from Operations |
2,584.37 |
2,166.81 |
19.27 |
|
Other Income |
578.06 |
315.80 |
83.05 |
|
Total Income |
3,162.43 |
2,482.61 |
27.38 |
|
Finance Costs |
9.09 |
9.69 |
(6.19) |
|
Fees and Commission Expenses |
2.48 |
3.68 |
(32.61) |
|
Employee Benefits Expenses |
353.46 |
312.67 |
13.05 |
|
Depreciation, Amortisation and Impairment |
52.26 |
53.34 |
(2.02) |
|
Other Expenses |
266.95 |
232.62 |
14.76 |
|
Total Expenses |
684.24 |
612.00 |
11.80 |
|
Profit before Tax |
2,478.19 |
1,870.61 |
32.48 |
|
Current Tax |
517.52 |
421.26 |
22.85 |
|
Deferred Tax Charge/(Credit) |
14.79 |
25.43 |
(41.84) |
|
Tax Expense |
532.31 |
446.69 |
19.17 |
|
Profit after Tax |
1,945.88 |
1,423.92 |
36.66 |
Management's Discussion and Analysis (MD&A)
"Management's Discussion and Analysis (MD&A) provides a comprehensive overview of key strengths and market outlook. It offers insights into key factors influencing the company's operations and financial results, aiding stakeholders in understanding its future prospects.
Strengths:
Strong financial performance, diversified product portfolio, high brand equity, and extensive distribution network.
Weaknesses:
Exposure to market volatility, regulatory changes, and competition from other financial products and fintech platforms.
Future Outlook
The mutual fund industry in India is poised for sustained growth driven by demographic trends, market dynamics, regulatory reforms, and technological advancements. Key growth drivers include increasing financial literacy, shift from traditional investments, growing popularity of Systematic Investment Plans (SIPs), expanding middle-class segment, rise of fintech platforms, and digital distribution channels.
- Expand market presence and increase AUM through innovative products and services.
- Strengthen risk management and compliance frameworks to mitigate operational risks.
HDFC AMC has demonstrated robust financial performance and resilience in a competitive market. With a strong strategic focus on growth, innovation, and customer-centric initiatives. Shareholders can look forward to sustained value creation driven by the company's proactive approach to market dynamics and regulatory changes.
Read the full Annual Report and AGM Notice Here
HDFC Asset Management Company Limited
HDFC Asset Management Company Limited (HDFC AMC) is a leading mutual fund house in India, offering a wide range of investment products including mutual funds and portfolio management services.
Established in 2000 and becoming a joint venture between HDFC Limited and abrdn Investment Management Limited in 2001, HDFC AMC has grown significantly through acquisitions and by going public in 2018.
The company manages assets worth ₹4.4 trillion as of March 31, 2023, with a vast network of 75,000 distributors and 228 branches across over 200 cities in India.Known for its discipline, governance, and commitment to stakeholders.
HDFC AMC provides tailored investment solutions to meet the unique financial needs of its clients, ranging from individuals to large institutions. The company's focus on transparency, risk management, and customer-centric initiatives has helped it build trust and deliver consistent performance.
Related Articles

HDFC AMC to Declare Rs 70 Interim Dividend per Share - FAQs
1. What was HDFC AMC's total income for FY 2023-24?
HDFC AMC's total income for FY 2023-24 is ₹3,162.43 crore
2. What percentage did HDFC AMC's total income increase in FY 2023-24?
HDFC AMC's total income increase in FY 2023-24 is 27.38%
3. What was the Profit After Tax (PAT) for HDFC AMC in FY 2023-24?
The Profit After Tax (PAT) for HDFC AMC in FY 2023-24 is ₹1,945.88 crore
4. What percentage did the PAT increase in FY 2023-24?
The PAT increase in FY 2023-243 is 6.66%
5. What was HDFC AMC's revenue from operations for FY 2023-24?
HDFC AMC's revenue from operations for FY 2023-24 is ₹2,584.37 crore
6. What percentage did the revenue from operations increase in FY 2023-24?
The revenue from operations increased by 19.27%
7. What was the other income for HDFC AMC in FY 2023-24?
The other income for HDFC AMC in FY 2023-24 is ₹578.06 crore
8. What percentage did the other income increase in FY 2023-24?
The other income increased by 83.05% in FY 2023-24
9. What were the total expenses for HDFC AMC in FY 2023-24?
The total expenses for HDFC AMC in FY 2023-24 is ₹684.24 crore
10. What percentage did the total expenses increase in FY 2023-24?
The total expenses increase in FY 2023-24 is 11.80%
11. What was the profit before tax for HDFC AMC in FY 2023-24?
The profit before tax for HDFC AMC in FY 2023-24 is ₹2,478.19 crore
12. What percentage did the profit before tax increase in FY 2023-24?
The profit before tax increase in FY 2023-24 by 32.48%
13. What was the current tax expense for HDFC AMC in FY 2023-24?
The current tax expense for HDFC AMC in FY 2023-24 is ₹517.52 crore
14. What percentage did the current tax expense increase in FY 2023-24?
The current tax expense increase in FY 2023-24 is 22.85%
15. What was the deferred tax charge for HDFC AMC in FY 2023-24?
The deferred tax charge for HDFC AMC in FY 2023-24 is ₹14.79 crore
16. What percentage did the deferred tax charge decrease in FY 2023-24?
The deferred tax charge decrease in FY 2023-24 is 41.84%
17. What was the total tax expense for HDFC AMC in FY 2023-24?
The total tax expense for HDFC AMC in FY 2023-24 is ₹532.31 crore
18. What percentage did the total tax expense increase in FY 2023-24?
The total tax expense increase in FY 2023-24 is 19.17%
19. What was the annual average AUM for HDFC AMC in FY 2023-24?
The annual average AUM for HDFC AMC in FY 2023-24 is ₹543,710.44 crore
20. What percentage did the annual average AUM increase in FY 2023-24?
The annual average AUM increase in FY 2023-24 is 24.67%
21. What was the PAT as a percentage of the annual average AUM in FY 2023-24?
The PATpercentage of the annual average AUM in FY 2023-24 is 0.36%
22. What was the debtors turnover ratio for HDFC AMC in FY 2023-24?
The debtors turnover ratio for HDFC AMC in FY 2023-24 is 18.66 times
23. What percentage did the debtors turnover ratio increase in FY 2023-24?
The debtors turnover ratio increased by 11.20% in FY 2023-24
24. What was the current ratio for HDFC AMC in FY 2023-24?
The current ratio for HDFC AMC in FY 2023-24 is 6.78 times
25. What percentage did the current ratio increase in FY 2023-24?
The current ratio increased by 10.24%
26. What was the operating profit margin for HDFC AMC in FY 2023-24?
The operating profit margin for HDFC AMC in FY 2023-24 is 73.52%
27. What percentage did the operating profit margin increase in FY 2023-24?
The operating profit margin increased by 2.45%
28. What was the net profit margin for HDFC AMC in FY 2023-24?
The net profit margin for HDFC AMC in FY 2023-24 is 61.53%
29. What percentage did the net profit margin increase in FY 2023-24?
The net profit margin increased by 7.27%
30. What is the finance cost for HDFC AMC in FY 2023-24?
The finance cost for HDFC AMC in FY 2023-24 ₹9.09 crore
Disclaimer : The above information is for general informational purposes only. All information on the Site is provided in good faith, however we make no representation or warranty of any kind, express or implied, regarding the accuracy, adequacy, validity, reliability, availability or completeness of any information on the Site.