Murugappa Group 70th AGM Approved Rs 2.50/Share Final Dividend
Murugappa Group's 70th AGM to approve ₹2.50/share final dividend with a 21.7% payout ratio is marking the highest overall dividend of ₹4.00 per share.
by Damodharan N
Updated Jul 09, 2024
Article continues below advertisement

Table of Content
The Murugappa Group's upcoming 70th Annual General Meeting (AGM) is set to be on July 30, 2024, through video conferencing. The meeting will consider several key resolutions, including the approval of a final dividend of ₹2.50 per equity share of ₹1 each for the financial year ended March 31, 2024.
with the board recommending a final dividend of ₹2.50 per share. This final dividend, combined with the interim dividend of ₹1.50 per share declared in January 2024, brings the total dividend for the financial year 2023-24 to ₹4.00 per share. This decision underscores the Group's commitment to rewarding its shareholders amidst a challenging economic environment.
- Dividend Details:
- The board has proposed a final dividend of ₹2.50 per equity share of ₹1 each.
- An interim dividend of ₹1.50 per equity share was declared and paid in February 2024.
- The total dividend for the year aggregates to ₹4.00 per share, reflecting a significant increase from previous years.
- Dividend Payout Ratio:
- The dividend payout ratio for 2024 is 21.7%, up from 20.1% in 2023. This indicates the company's robust operating profit and its ability to distribute higher returns to shareholders.
- Historical Context:
- The Murugappa Group has a commendable track record of consistent dividend payouts since 1957, showcasing its long-term commitment to shareholder value.
- The dividend history indicates an increasing trend in payouts:
- ₹3.00 per share in 2020
- ₹3.50 per share in 2021 and 2022
- ₹4.00 per share in 2023
- Total Shareholder Return (TSR):
- The Total Shareholder Return (TSR) has been impressive over the past few years, with notable figures such as 131% in the year 2020, 57% in 2021, followed by 24% in 2022 and 29% for 2023 respectively. This showcases the company's strong performance and effective capital allocation strategies.
The AGM will also address several other important matters, including the adoption of audited financial statements, re-appointment of key directors, and ratification of the cost auditor's remuneration.
Additionally, the board's proposal to pay a commission to the Non-Executive Chairman reflects the company's commitment to rewarding its leadership for their contributions.
Murugappa Annual Report
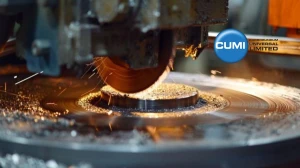
Carborundum Universal Limited (CUMI) is a part of the Murugappa Group, and is a leader in the abrasives industry. The company manufactures a variety of products including bonded and coated abrasives, super refractories, electro minerals, and industrial ceramics.
Business Verticals:
Business verticals refer to the distinct industries or sectors that a company operates within. These verticals represent the specific markets and customer segments a business serves, each with its own unique challenges, regulations, and growth opportunities. We have only main businesses that are core of the company
- Abrasives: Includes bonded and coated abrasives, which are used in a wide range of applications.
- Ceramics: Encompasses industrial ceramics, super refractories, and anti-corrosive products.
- Electro Minerals: Involves the production of materials like silicon carbide, alumina, and zirconia, used in various industrial applications.
- Advanced materials: Anti-bacterial, corrosion resistance, Friction, Lubricity, Phase change, Semi conducting, Thermal storage.
Financial Performance for FY 23-24:
The financial performance of companies across various business verticals for FY 2023-24 showed strong growth, with most reporting increased revenues, EBITDA, and net profits compared to the previous year.
- Revenue: ₹46,282 million (Consolidated), ₹25,932 million (Standalone)
- PBIT: ₹6,686 million (Consolidated), ₹4,672 million (Standalone)
- PAT: ₹4,613 million (Consolidated), ₹3,504 million (Standalone)
- ROCE: 20% (Consolidated), 21% (Standalone)
- Dividend: ₹4.00 per share (400% on face value of ₹1 per share)
From the director's Report business verticals-wise performance for 23-24
|
Segment |
2023-24 |
2022-23 |
Growth |
|
Consolidated |
₹46,282 |
₹46,010 |
1% |
|
Abrasives |
₹20,910 |
₹20,353 |
3% |
|
Ceramics |
₹10,767 |
₹10,273 |
5% |
|
Electrominerals |
₹15,447 |
₹16,338 |
(5%) |
|
Power |
₹327 |
₹259 |
26% |
|
IT Services |
₹573 |
₹585 |
(2%) |
|
Others |
₹617 |
₹542 |
14% |
|
Eliminations |
(₹2,359) |
(₹2,340) |
1% |
|
India |
₹21,427 |
₹20,321 |
5% |
|
Rest of the World |
₹24,855 |
₹25,689 |
(3%) |
Financial Ratios on a standalone basis
|
Parameter |
2023-24 |
2022-23 |
Favourable/ (Adverse) in % |
Comments |
|
ROCE (%) |
20.4 |
21.2 |
(4) |
Reduction is due to inclusion of exceptional income in last year |
|
Debt Equity (times) |
- |
0.05 |
100 |
Due to repayment of entire current borrowings. |
|
PBT (%) to Sales* |
17.9 |
16.4 |
9 |
Increase due to better profitability. |
|
Asset turnover (times) |
1.76 |
1.84 |
(4) |
There is no significant movement |
|
Receivable turnover (days) |
54 |
53 |
(2) |
At the same level |
|
Inventory turnover (days) |
52 |
58 |
10 |
Improved due to effective inventory management |
|
Interest Coverage Ratio (times) |
130.1 |
33.0 |
294 |
Significant reduction in Finance costs consequent to repayment of borrowings during the current year resulting in better coverage for the year |
|
Current Ratio (times) |
3.4 |
2.0 |
70 |
Due to repayment of entire current borrowings. |
|
Operating Profit Margin (%)* |
16.1 |
15.2 |
6 |
Increased efficiency and product mix |
|
Net Profit Margin (%) |
13.5 |
13.4 |
1 |
Stable margin |
|
Return on Net Worth (%) |
16.3 |
17.7 |
(8) |
Reduction is due to inclusion of exceptional income in last year |
Production and Sales Milestones:
Production and sales milestones are key performance indicators that track a company's manufacturing output and revenue generation over time. These milestones provide valuable insights into a business's growth, efficiency, and market performance, helping management make informed decisions to optimize operations and drive profitability.
- The company has achieved significant milestones in various sectors including defense, semiconductor, and industrial ceramics.
- Developed and supplied special ceramic for the Ahmedabad-Mumbai bullet train project.
- Expansion in semiconductor space with timely qualifications with equipment suppliers.
- Large projects executed in the thermal power sector in Vietnam.
Management's Discussion and Analysis:
Management's Discussion and Analysis (MD&A) provides a comprehensive overview of a company's financial performance, operational highlights, and strategic priorities, as discussed and interpreted by its executive leadership.
- The company continues to explore growth opportunities in core businesses and emerging areas like clean energy, electric mobility, semiconductors, and advanced manufacturing.
- Focus on leveraging India’s growth potential driven by digital revolution and supportive regulatory environment.
Future Outlook:
The future outlook for businesses across various verticals remains positive, with continued growth and expansion expected in the coming years. Companies are focused on diversifying their product portfolios, investing in digital transformation, and exploring strategic partnerships to drive long-term sustainable growth.
- The company is optimistic about future growth, driven by robust macroeconomic indicators and government initiatives like the Production Linked Incentive (PLI) scheme.
- Continued focus on innovation, customer collaboration, and expanding into new markets.
Carborundum Universal Limited remains committed to its growth trajectory by focusing on innovation, quality, and expansion into emerging markets and sectors. The company’s strong financial performance and strategic initiatives indicate a promising future.
Read the full annual Report and AGM Notice Here
Carborundum Universal Limited
Carborundum Universal Limited (CUMI), a part of the 124-year-old Murugappa Group, started as an abrasives company in 1954. Over the decades, CUMI has evolved into a diversified materials science company with operations spanning mining, power generation, manufacturing, and distribution of products like abrasives, electrominerals, industrial ceramics, and energy storage materials.
With a global footprint and a commitment to innovation, CUMI has established itself as a leading player in its key business segments, including being among the largest global producers of silicon carbide grains, a major global producer of electrominerals, and the second-largest global producer of metallized cylinders.
CUMI's extensive network, strong R&D capabilities, and focus on sustainability have enabled it to build enduring relationships and deliver innovative solutions to customers worldwide.
Related Articles
Murugappa Group 70th AGM to Approve Rs 2.50/Share Final Dividend - FAQs
1. What is the consolidated revenue for FY 23-24?
The consolidated revenue for FY 23-24 is ₹46,282 million.
2. What is the standalone revenue for FY 23-24?
The standalone revenue for FY 23-24 is ₹25,932 million.
3. What is the consolidated PBIT for FY 23-24?
The consolidated PBIT for FY 23-24 is ₹6,686 million.
4. What is the standalone PBIT for FY 23-24?
The standalone PBIT for FY 23-24 is ₹4,672 million.
5. What is the consolidated PAT for FY 23-24?
The consolidated PAT for FY 23-24 is ₹4,613 million.
6. What is the standalone PAT for FY 23-24?
The standalone PAT for FY 23-24 is ₹3,504 million.
7. What is the consolidated ROCE for FY 23-24?
The consolidated ROCE for FY 23-24 is 20%.
8. What is the standalone ROCE for FY 23-24?
The standalone ROCE for FY 23-24 is 21%
9. What is the dividend per share for FY 23-24?
The dividend per share for FY 23-24 is ₹4.00.
10. What was the revenue growth in abrasives for FY 23-24?
The revenue growth in abrasives for FY 23-24 was 3%.
11. What was the revenue growth in ceramics for FY 23-24?
The revenue growth in ceramics for FY 23-24 was 5%.
12. What was the revenue change in electro minerals for FY 23-24?
The revenue in electro minerals decreased by 5% for FY 23-24.
13. What was the revenue growth in power for FY 23-24?
The revenue growth in power for FY 23-24 was 26%.
14. What was the revenue change in IT services for FY 23-24?
The revenue in IT services decreased by 2% for FY 23-24.
15. What was the revenue growth in others for FY 23-24?
The revenue growth in other segments for FY 23-24 was 14%.
16. What was the revenue growth in India for FY 23-24?
The revenue growth in India for FY 23-24 was 5%.
17. What was the revenue change in the rest of the world for FY 23-24?
The revenue in the rest of the world decreased by 3% for FY 23-24.
18. What is the debt-equity ratio for FY 23-24?
The debt-equity ratio for FY 23-24 is 0.0
19. What is the PBT to sales ratio for FY 23-24?
The PBT to sales ratio for FY 23-24 is 17.9%.
20. What is the asset turnover ratio for FY 23-24?
The asset turnover ratio for FY 23-24 is 1.76 times.
21. What is the receivable turnover ratio for FY 23-24?
The receivable turnover ratio for FY 23-24 is 54 days.
22. What is the inventory turnover ratio for FY 23-24?
The inventory turnover ratio for FY 23-24 is 52 days.
23. What is the interest coverage ratio for FY 23-24?
The interest coverage ratio for FY 23-24 is 130.1 times.
24. What is the current ratio for FY 23-24?
The current ratio for FY 23-24 is 3.4 times.
25. What is the operating profit margin for FY 23-24?
The operating profit margin for FY 23-24 is 16.1%.
26. What is the net profit margin for FY 23-24?
The net profit margin for FY 23-24 is 13.5%.
27. What is the return on net worth for FY 23-24?
The return on net worth for FY 23-24 is 16.3%.
28. What is the revenue trend from FY20 to FY24?
The revenue increased from ₹16,231 million in FY20 to ₹25,936 million in FY24.
29. How did the ROCE change from FY20 to FY24?
The ROCE decreased from 20% in FY20 to 19% in FY24.
Disclaimer : The above information is for general informational purposes only. All information on the Site is provided in good faith, however we make no representation or warranty of any kind, express or implied, regarding the accuracy, adequacy, validity, reliability, availability or completeness of any information on the Site.