- Home »
- Quarterly Results »
- Sonam Q2 Results Revenue Grows & Net Income Hits ₹1.34 Crores
Sonam Q2 Results Revenue Grows & Net Income Hits ₹1.34 Crores
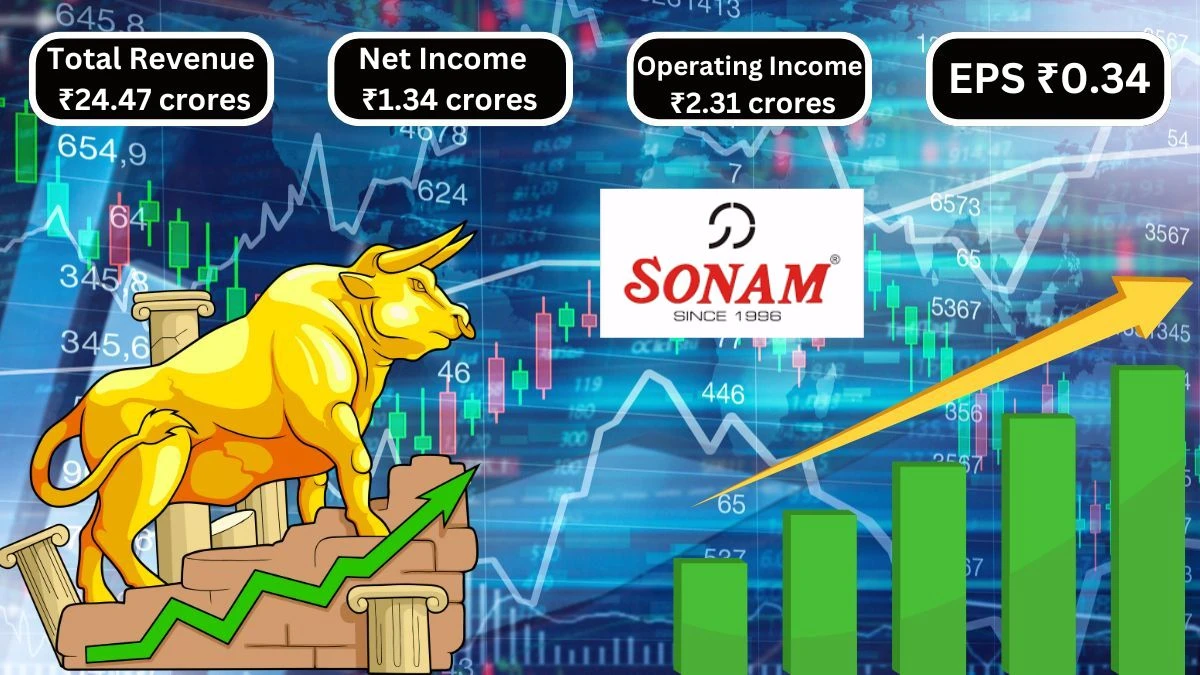
Sonam Q2 Results show Total Revenue of ₹24.47 crores, up from ₹17.37 crores in the previous quarter and Net Income reached ₹1.34 crores, an increase from ₹0.75 crores in the last quarter.
by Ruksana
Updated Oct 18, 2024
Table of Content
Sonam Q2 Results: The SONAM Q2 financial results table shows the company's performance for September 2024 compared to previous quarters. In September 2024, SONAM earned a total revenue of ₹24.47 crores, which is an increase from ₹17.37 crores in June 2023 but slightly lower than ₹24.62 crores in September 2023. This indicates that while the company is doing better than in the previous quarter, it has not fully recovered to its revenue levels from the same time last year.
Sonam’s total operating expenses for September 2024 were ₹22.17 crores, up from ₹15.67 crores in June 2023 and close to ₹22.05 crores in September 2023. Operating income, which is the profit before deducting taxes and other costs, was ₹2.31 crores, an increase from ₹1.70 crores in June 2023 but less than the ₹2.57 crores in September 2023.
Sonam’s net income, or the profit after all expenses, was ₹1.34 crores, rising from ₹0.75 crores in June 2023 but also below the ₹1.19 crores from September 2023. The diluted normalized earnings per share (EPS) for September 2024 was ₹0.34, down from ₹0.38 in June 2023 and ₹0.60 in September 2023.
Here’s the quarterly financial summary for SONAM Q2, presented in a table format:
|
Metric |
Sep 2024 |
Jun 2023 |
QoQ Change (%) |
Sep 2023 |
YoY Change (%) |
|
Total Revenue |
24.47 |
17.37 |
- |
24.62 |
- |
|
Selling/General/Admin Expenses |
1.54 |
1.30 |
- |
1.40 |
- |
|
Depreciation/Amortization |
0.67 |
0.57 |
- |
0.85 |
- |
|
Other Operating Expenses |
1.77 |
1.37 |
- |
1.18 |
- |
|
Total Operating Expense |
22.17 |
15.67 |
- |
22.05 |
- |
|
Operating Income |
2.31 |
1.70 |
- |
2.57 |
- |
|
Net Income Before Taxes |
1.80 |
1.07 |
- |
1.67 |
- |
|
Net Income |
1.34 |
0.75 |
- |
1.19 |
- |
|
Diluted Normalized EPS |
0.34 |
0.38 |
- |
0.60 |
- |
Source: Here
For More Quarterly Results check our Twitter Page
Visit our website for more Quarterly results
Sonam Q2 Results
Sonam earned money from its main operations, totaling ₹2,447.36 lakhs in the quarter ending on 30.09.2024. This was an increase from ₹2,267.10 lakhs in the previous quarter. The total income includes net sales and other income, which gives a clear picture of how much the company is making.
Sonam also has expenses, such as costs for materials, employee salaries, and other operating costs. The total expenses for the latest quarter were ₹2,242.82 lakhs, which is higher than in the previous quarter.
Sonam made a profit before tax of ₹179.58 lakhs. After paying taxes, the net profit for the quarter was ₹134.35 lakhs.
Here's the financial data you provided in a clear table format:
(Rs. in Lakhs)
|
Particulars |
Quarter Ended 30.09.2024 (Unaudited) |
Quarter Ended 30.06.2024 (Unaudited) |
Half Year Ended 30.09.2024 (Unaudited) |
Half Year Ended 30.09.2023 (Unaudited) |
Year Ended 31.03.2024 (Audited) |
|
1. Revenue from Operation: |
|||||
|
a) Net sales/Income from Operation (Net of GST) |
2,442.26 |
2,259.73 |
4,701.99 |
4,175.40 |
8,728.00 |
|
b) Other operating Income |
5.10 |
7.37 |
12.47 |
23.09 |
35.87 |
|
Total Income from Operations (net) |
2,447.36 |
2,267.10 |
4,714.46 |
4,198.50 |
8,763.87 |
|
2. Expenses: |
|||||
|
a) Cost of Materials Consumed |
1,125.57 |
1,249.20 |
2,374.78 |
2,056.86 |
3,400.62 |
|
b) Purchase of Stock-in-trade |
657.66 |
622.07 |
1,279.73 |
1,111.35 |
2,701.71 |
|
c) Change in inventories of finished goods, Work-in-progress & Stock-in-trade |
36.21 |
(160.74) |
(124.53) |
162.03 |
222.39 |
|
d) Employees benefit expenses |
153.58 |
131.28 |
284.86 |
265.28 |
614.95 |
|
e) Depreciation and amortisation Expenses |
67.18 |
66.10 |
133.29 |
142.06 |
258.67 |
|
f) Other Expenses |
202.61 |
166.69 |
369.30 |
284.55 |
610.63 |
|
Total Expenses |
2,242.82 |
2,074.61 |
4,317.43 |
3,802.06 |
7,809.60 |
|
3. Profit/(Loss) from Operations before other income, finance costs and exceptional items |
204.54 |
192.49 |
397.03 |
396.43 |
954.27 |
|
4. Other Income |
25.08 |
36.36 |
61.33 |
30.23 |
72.94 |
|
5. Profit (Loss) from ordinary activities before finance costs and exceptional items |
230.52 |
228.85 |
459.36 |
426.66 |
1,027.21 |
|
6. Finance Costs |
52.59 |
103.52 |
157.50 |
286.22 |
551.58 |
|
7. Profit (Loss) from ordinary activities after finance costs but before exceptional items |
179.58 |
176.26 |
355.84 |
274.16 |
740.99 |
|
8. Profit/(Loss) from ordinary activities before tax |
179.58 |
176.26 |
355.84 |
274.16 |
740.99 |
|
9. Exceptional items |
|||||
|
10. Tax Expenses |
|||||
|
Current Tax - Pertaining to Current Year |
45.00 |
46.00 |
91.00 |
73.20 |
182.00 |
|
Current Tax - Pertaining to Prior Year |
0.23 |
12.90 |
13.13 |
6.15 |
(4.16) |
|
Deferred Tax |
11.57 |
||||
|
Total Tax Expenses |
45.23 |
58.90 |
104.13 |
79.38 |
189.41 |
|
11. Net Profit/(Loss) from ordinary activities after tax |
134.35 |
117.36 |
251.71 |
194.78 |
551.58 |
|
12. Extra Ordinary items (Net off tax expenses) |
|||||
|
13. Net Profit/(Loss) for the period |
134.35 |
117.36 |
251.71 |
194.78 |
551.58 |
|
16. Total Comprehensive Income for the Period (13+14) |
134.35 |
117.36 |
251.71 |
194.78 |
551.58 |
|
17. Paid-up equity share capital (Face Value of Rs.5 each) |
20,01,60,000 |
20,01,60,000 |
20,01,60,000 |
20,01,60,000 |
20,01,60,000 |
|
18. Reserves (Excluding Revaluation Reserves) |
2,684.88 |
2,550.53 |
2,684.88 |
2,076.37 |
2,433.17 |
|
19. EPS before Extraordinary & Exceptional items for the period year from Continued & Discontinued Operations |
|||||
|
a) Basic |
0.34 |
0.29 |
0.63 |
0.49 |
1.38 |
|
b) Diluted |
0.34 |
0.29 |
0.63 |
0.49 |
1.38 |
Sonam Stock Performance
Sonam’s Current Price of ₹ 81.1 is how much one share costs right now. The High/Low figures indicate that the share price reached a maximum of ₹ 86.0 and a minimum of ₹ 33.2 in the past. The Stock P/E ratio of 53.4 shows how much investors are willing to pay for each unit of profit. Book Value is ₹ 14.8, representing the company's net asset value per share.
Here’s the financial information you provided, presented in a clear table format:
|
Financial Metric |
Value |
|
Market Cap |
₹ 325 Cr. |
|
Current Price |
₹ 81.1 |
|
High / Low |
₹ 86.0 / ₹ 33.2 |
|
Stock P/E |
53.4 |
|
Book Value |
₹ 14.8 |
|
Dividend Yield |
0.00 % |
|
ROCE |
13.1 % |
|
ROE |
10.2 % |
|
Face Value |
₹ 5.00 |
Quarterly Results
In the quarters of March 2024, June 2024, and September 2024, Sonam's financial performance showed some changes. In March 2024, the sales were ₹22.28 crores, with expenses at ₹19.12 crores, resulting in an operating profit of ₹3.16 crores and an operating profit margin (OPM) of 14.18%. By June 2024, sales slightly increased to ₹22.67 crores, but expenses also rose to ₹20.08 crores, leading to a lower operating profit of ₹2.59 crores and an OPM of 11.42%. In September 2024, sales further increased to ₹24.47 crores, while expenses reached ₹21.75 crores, resulting in an operating profit of ₹2.72 crores with an OPM of 11.12%.
Here's the data for the quarters Mar 2024, Jun 2024, and Sep 2024, focusing only on the particulars:
(Figures in Rs. Crores)
|
Particulars |
Mar 2024 |
Jun 2024 |
Sep 2024 |
|
Sales |
22.28 |
22.67 |
24.47 |
|
Expenses |
19.12 |
20.08 |
21.75 |
|
Operating Profit |
3.16 |
2.59 |
2.72 |
|
OPM % |
14.18% |
11.42% |
11.12% |
|
Other Income |
0.24 |
0.36 |
0.26 |
|
Interest |
0.47 |
0.53 |
0.51 |
|
Depreciation |
0.74 |
0.66 |
0.67 |
|
Profit Before Tax |
2.19 |
1.76 |
1.80 |
|
Tax % |
23.74% |
33.52% |
25.00% |
|
Net Profit |
1.68 |
1.17 |
1.34 |
|
EPS in Rs |
0.42 |
0.29 |
0.33 |
About Sonam
Sonam Click is recognized as one of India's largest customized clock manufacturers, notably achieving remarkable growth in the horological industry, especially in corporate gifting. The company boasts state-of-the-art technology and equipment, strategically employed by a highly skilled management team. A significant portion of the workforce consists of women from nearby villages, contributing to the company's values of dedication, commitment, and hard work.
Over the past seven years, Sonam Click has steadily progressed, becoming a leading player in customized clock manufacturing. The company offers a diverse range of products, including Clicks, LED clocks, and timepieces. With a robust production capacity and a strong marketing network, Sonam Click is well-positioned for continued success in the industry.
Sonam Q2 Results - FAQs
1. What was Sonam Click's total revenue for Q2 2024?
Sonam Click's total revenue for Q2 2024 was ₹24.47 crores.
2. How did Sonam Click's total revenue in September 2024 compare to June 2023?
Sonam Click's revenue in September 2024 increased from ₹17.37 crores in June 2023.
3. What were Sonam Click's operating expenses for September 2024?
Sonam Click's total operating expenses for September 2024 were ₹22.17 crores.
4. How much was Sonam Click's net income in Q2 2024?
Sonam Click's net income for Q2 2024 was ₹1.34 crores.
5. What were Sonam Click's total expenses for the quarter ending September 2024?
Sonam Click's total expenses for the quarter ending September 2024 were ₹2,242.82 lakhs.
6. How much profit before tax did Sonam Click report for Q2 2024?
Sonam Click reported a profit before tax of ₹179.58 lakhs for Q2 2024.
7. What is the current market cap of Sonam Click?
Sonam Click's current market cap is ₹325 crores.
8. What was Sonam Click's net profit for the half-year ended September 2024?
Sonam Click's net profit for the half-year ended September 2024 was ₹251.71 lakhs.
9. How did Sonam Click's net income in September 2024 compare to September 2023? 023.
Sonam Click's net income in September 2024 was lower than ₹1.19 crores in September 2
10. What was the stock P/E ratio for Sonam Click as of now?
The stock P/E ratio for Sonam Click is 53.4.
