- Home »
- Quarterly Results »
- TCS Q1 Results Revenue Up 2.25% QoQ and 5.44% YoY
TCS Q1 Results Revenue Up 2.25% QoQ and 5.44% YoY
Tata Consultancy Services (TCS) Q1 Results reported a revenue of ₹62,613 crore for Q1 FY2024, which is a 2.25% increase quarter-over-quarter (QoQ) and a 5.44% rise year-over-year (YoY).
by Ruksana
Updated Aug 29, 2024
Article continues below advertisement

Table of Content
TCS Q1 Results: Tata Consultancy Services (TCS) reported its financial results for the first quarter of the fiscal year ending June 2024. The company earned a total revenue of ₹62,613 crores, which is a 2.25% increase from the previous quarter but a 5.44% increase compared to the same quarter last year. The company's expenses for selling, general, and administrative costs were ₹43,248 crores, up 4.63% from the previous quarter but down 1.43% from last year. Depreciation and amortization costs were ₹1,220 crores, slightly down by 2.09% from the previous quarter and 1.85% from the same quarter last year. There were new operating expenses of ₹552 crores this quarter, compared to none last quarter.
Tata Consultancy Services’ total operating expenses increased by 4.08% from the previous quarter to ₹47,164 crores but were up 3.37% from the same period last year. Operating income, which is the profit before other expenses, was ₹15,449 crores, down 2.98% from the last quarter but up 12.32% year-over-year. The net income before taxes was ₹16,231 crores, a decrease of 3.67% from the previous quarter but an increase of 8.29% from last year.
Tata Consultancy Services’ net income, or the final profit, was ₹12,040 crores, down 3.17% from the last quarter but up 8.72% compared to last year. The diluted normalized earnings per share (EPS) were ₹33.26, down 3.18% from the last quarter but up 9.91% year-over-year. This shows that while some expenses increased, the company’s overall financial performance improved compared to the same period last year.
Here's a summary of Tata Consultancy Services' Q1 results for June 2024:
|
Metric |
Jun 24 |
Mar 23 |
QoQ Change |
Jun 23 |
YoY Change |
|
Total Revenue |
62,613.00 |
59,162.00 |
+2.25% |
59,381.00 |
+5.44% |
|
Selling/General/Admin Expenses |
43,248.00 |
42,768.00 |
+4.63% |
43,877.00 |
-1.43% |
|
Depreciation/Amortization |
1,220.00 |
1,286.00 |
-2.09% |
1,243.00 |
-1.85% |
|
Other Operating Expenses |
552.00 |
0.00 |
-53.10% |
- |
N/A |
|
Total Operating Expense |
47,164.00 |
44,677.00 |
+4.08% |
45,626.00 |
+3.37% |
|
Operating Income |
15,449.00 |
14,485.00 |
-2.98% |
13,755.00 |
+12.32% |
|
Net Income Before Taxes |
16,231.00 |
15,391.00 |
-3.67% |
14,989.00 |
+8.29% |
|
Net Income |
12,040.00 |
11,392.00 |
-3.17% |
11,074.00 |
+8.72% |
|
Diluted Normalized EPS |
33.26 |
31.13 |
-3.18% |
30.26 |
+9.91% |
Source: Here
For More Q1 Results check our Twitter Page
Visit our website for more Q1 results
TCS Q1 Results
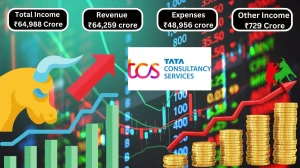
Tata Consultancy Services (TCS) recently shared its financial results for the three months ending June 30, 2024, and for the year ending March 31, 2024. For the three months, TCS earned ₹62,613 crore from its operations, slightly more than the ₹61,237 crore earned in the previous three months. The company also earned ₹962 crore in other income, totaling ₹63,575 crore in total income.
Tata Consultancy Services’ expenses included ₹36,416 crore for employee benefits, ₹2,151 crore for equipment and software, ₹173 crore in finance costs, ₹1,220 crore for depreciation, and ₹7,384 crore in other expenses. This made their total expenses ₹47,344 crore, which was higher than ₹45,545 crore in the last period. The profit before tax was ₹16,231 crore, down from ₹16,849 crore before.
Tata Consultancy Services’ After tax expenses of ₹4,126 crore, the profit for the period was ₹12,105 crore. The company also had a loss of ₹214 crore in other comprehensive income, leading to a total comprehensive income of ₹11,891 crore. Comparing to the previous year, TCS had a higher total revenue and profit, showing strong financial performance despite higher expenses.
Here’s the financial information for Tata Consultancy Services (TCS) presented in a four-column table:
|
Details |
June 30, 2024 |
March 31, 2024 |
June 30, 2023 |
March 31, 2024 |
|
Revenue from Operations |
62,613 |
61,237 |
59,381 |
240,893 |
|
Other Income |
962 |
1,157 |
1,397 |
4,422 |
|
Total Income |
63,575 |
62,394 |
60,778 |
245,315 |
|
Employee Benefit Expenses |
36,416 |
35,138 |
35,148 |
140,131 |
|
Cost of Equipment & Software |
2,151 |
1,561 |
506 |
3,702 |
|
Finance Costs |
173 |
226 |
163 |
778 |
|
Depreciation & Amortization |
1,220 |
1,246 |
1,243 |
4,985 |
|
Other Expenses |
7,384 |
7,374 |
8,729 |
32,764 |
|
Total Expenses |
47,344 |
45,545 |
45,789 |
182,360 |
|
Profit Before Tax |
16,231 |
16,849 |
14,989 |
62,955 |
|
Tax Expense |
4,126 |
4,347 |
3,869 |
15,898 |
|
Profit for the Period |
12,105 |
12,502 |
11,120 |
46,099 |
|
Other Comprehensive Income |
(214) |
(262) |
80 |
237 |
|
Total Comprehensive Income |
11,891 |
12,240 |
11,200 |
46,336 |
|
Earnings Per Share (Basic & Diluted) |
₹33.28 |
₹34.37 |
₹30.26 |
₹125.88 |
|
Dividend per Share |
₹10.00 |
₹28.00 |
₹9.00 |
₹45.00 |
|
Paid-Up Equity Share Capital |
₹362 crore |
₹362 crore |
₹366 crore |
₹362 crore |
TCS Stock Performance
The table shows key financial details for TCS, a large company. The Market Cap of ₹16,40,133 Crore means the total value of all its shares. The Current Price of ₹4,533 is what one share costs right now. High / Low shows the highest price of ₹4,565 and the lowest price of ₹3,311 for the stock in a certain period. Stock P/E of 34.5 indicates how much investors are willing to pay for each rupee of earnings.
Here's the information in table format:
|
Metric |
Value |
|
Market Cap |
₹16,40,133 Cr. |
|
Current Price |
₹4,533 |
|
High / Low |
₹4,565 / ₹3,311 |
|
Stock P/E |
34.5 |
|
Book Value |
₹250 |
|
Dividend Yield |
1.21% |
|
ROCE |
64.3% |
|
ROE |
51.5% |
|
Face Value |
₹1.00 |
Quarterly Results
The table shows TCS's financial results for December 2023, March 2024, and June 2024. In these months, the company’s sales grew steadily, reaching ₹62,613 crores by June 2024. Expenses also increased, peaking at ₹45,951 crores. Operating profit was strong but varied, with a slight dip in June 2024 to ₹16,662 crores.
Here’s a summary of the financial results for December 2023, March 2024, and June 2024:
|
Metric |
Dec 2023 |
Mar 2024 |
Jun 2024 |
|
Sales (Rs. Crores) |
60,583 |
61,237 |
62,613 |
|
Expenses (Rs. Crores) |
44,195 |
44,073 |
45,951 |
|
Operating Profit (Rs. Crores) |
16,388 |
17,164 |
16,662 |
|
Operating Profit Margin (OPM %) |
27% |
28% |
27% |
|
Other Income (Rs. Crores) |
-96 |
1,157 |
962 |
|
Interest (Rs. Crores) |
230 |
226 |
173 |
|
Depreciation (Rs. Crores) |
1,233 |
1,246 |
1,220 |
|
Profit Before Tax (Rs. Crores) |
14,829 |
16,849 |
16,231 |
|
Tax Rate (%) |
25% |
26% |
25% |
|
Net Profit (Rs. Crores) |
11,097 |
12,502 |
12,105 |
|
EPS (Rs.) |
30.56 |
34.37 |
33.28 |
About TCS
Tata Consultancy Services (TCS) is a leading IT services, consulting, and business solutions company. For over 50 years, TCS has worked with many of the world’s largest businesses to help them grow and succeed. The company believes in using innovation and shared knowledge to make a positive impact on the future. TCS is committed to building strong, long-lasting relationships with its clients, which leads to mutual growth and sustainable success.
Tata Consultancy Services focuses on using green practices to be environmentally friendly and integrates this approach into its operations. TCS is known for its extensive knowledge network, which helps it deliver real and effective solutions to its clients. It also provides the agility and continuity needed to handle constant changes and uncertainties in the business world.
With a global workforce of over 600,000 employees from 152 nationalities, Tata Consultancy Services promotes diversity and inclusivity in its workplace. The company invests heavily in employee development, with millions of hours dedicated to learning and skills development each year. TCS is also involved in corporate social responsibility, supporting education, employment, and entrepreneurship, and it follows a sustainable approach to business.
Related Articles
TCS Q1 Results - FAQs
1. How did Tata Consultancy Services' revenue change from the previous quarter?
Tata Consultancy Services' revenue increased by 2.25% from the previous quarter.
2. What were Tata Consultancy Services' operating income for June 2024?
Tata Consultancy Services' operating income for June 2024 was ₹15,449 crore.
3. Did Tata Consultancy Services' net income increase or decrease from last year?
Tata Consultancy Services' net income increased by 8.72% from last year.
4. How much did Tata Consultancy Services spend on selling, general, and administrative expenses in Q1 FY2024?
Tata Consultancy Services spent ₹43,248 crore on selling, general, and administrative expenses in Q1 FY2024.
5. What was the change in Tata Consultancy Services' depreciation and amortization costs compared to last year?
Tata Consultancy Services' depreciation and amortization costs decreased by 1.85% compared to last year.
6. How did Tata Consultancy Services' net income before taxes compare to the previous quarter?
Tata Consultancy Services' net income before taxes decreased by 3.67% compared to the previous quarter.
7. What were Tata Consultancy Services' total operating expenses for Q1 FY2024?
Tata Consultancy Services' total operating expenses for Q1 FY2024 were ₹47,164 crore.
8. How did Tata Consultancy Services' earnings per share (EPS) change year-over-year?
Tata Consultancy Services' diluted normalized EPS increased by 9.91% year-over-year.
9. What was the impact of other operating expenses on Tata Consultancy Services' financials in Q1 FY2024?
Tata Consultancy Services had new operating expenses of ₹552 crore in Q1 FY2024.
Disclaimer : The above information is for general informational purposes only. All information on the Site is provided in good faith, however we make no representation or warranty of any kind, express or implied, regarding the accuracy, adequacy, validity, reliability, availability or completeness of any information on the Site.